10-Year SIP Ended at -0.13%: Small-Caps Can Still Lose Money
Edelweiss Mutual Fund data shows the worst 10-year small-cap SIP ended slightly negative, while mid-caps and large-caps never did. Here is what that means for your SIP.
You start a monthly SIP, never miss an instalment, and leave it alone for a full decade. Most of us assume that patience alone guarantees a profit.
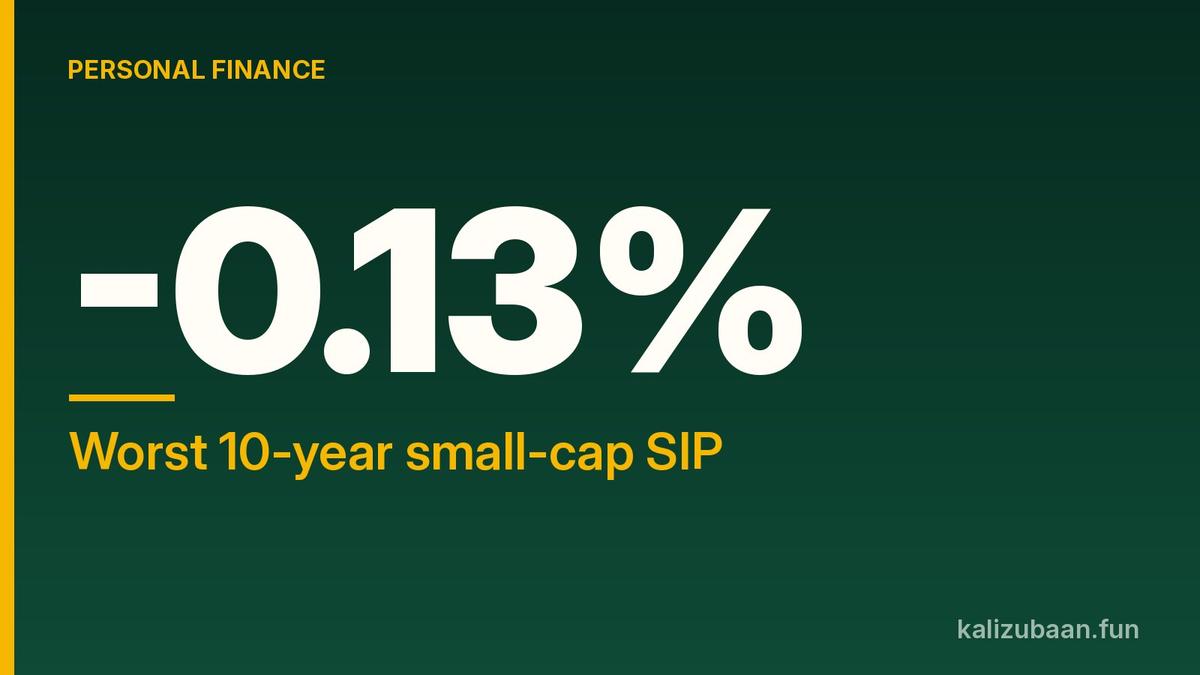
Historical data says otherwise. According to research by Edelweiss Mutual Fund, the worst 10-year rolling SIP return for the Nifty Smallcap 250 Total Returns Index (TRI) was -0.13%. Ten years of discipline, and the money still ended slightly below zero.
Quick answer
- Yes, a 10-year SIP can end with a loss. In Edelweiss's data, the worst small-cap outcome was -0.13% a year.
- Large-caps and mid-caps never went negative over ten years. Their worst outcomes were 5.07% and 6.37% a year.
- Mid-caps, not small-caps, gave the best average return over ten years, at 17.61%.
- An SIP spreads your buying across market levels. It does not protect you from the risk of the asset you buy.
Why this matters now
Mint reported these figures on 22 October, using Edelweiss Mutual Fund data as of 30 September. The timing matters because a lot of new money is heading into small-caps right now.
According to AMFI data quoted by Mint, small-cap funds attracted around ₹9,039 crore in September 2026. That was 23.6% of all equity mutual fund inflows that month. Large-cap funds got around ₹859 crore, after outflows in July and August.
When that much money chases one category, it helps to look at the worst case, not just the best one.
What the 10-year numbers actually say
Edelweiss used rolling SIP returns. Instead of picking one start date and one end date, this method checks SIPs started at many different points in history. It assumes a monthly investment at the end of each month.
Here is how the three market segments did over ten-year windows:
- Large-caps (Nifty 100 TRI): worst 5.07%, best 17.02%, average 12.95%.
- Mid-caps (Nifty Midcap 150 TRI): worst 6.37%, best 23.60%, average 17.61%.
- Small-caps (Nifty Smallcap 250 TRI): worst -0.13%, best 22.20%, average 15.01%.
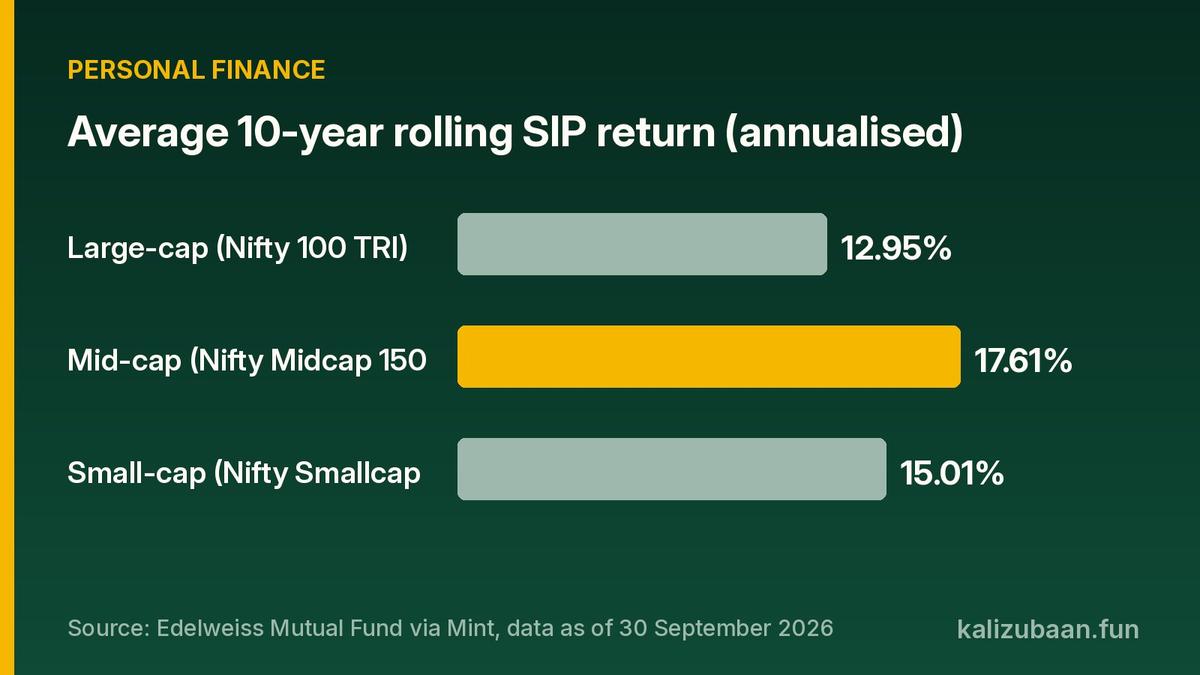
Source: Edelweiss Mutual Fund via Mint, data as of 30 September 2026
Two things stand out. Small-caps had the widest gap between their best and worst outcomes. And mid-caps led small-caps on both the average and the best ten-year return.
So the category many people pick for the highest returns was not the top performer on average, and it was the only one with a losing decade.
Five-year SIPs swing even harder
The picture gets sharper over shorter periods. Over five-year windows, every segment had at least one losing stretch:
- Small-caps: worst -16.81%, best 38.26%, average 15.48%.
- Mid-caps: worst -6.71%, best 36.14%, average 17.64%.
- Large-caps: worst -3.03%, best 22.95%, average 13.01%.
Small-caps had the highest best-case return over five years. But their worst case was far deeper than the other two. Mid-caps again had the best average.
Comparing the two tables, a longer holding period generally gave better worst-case outcomes. It just did not remove losses in every category. Small-caps stayed marginally negative in their worst ten-year observation.
Who should pay attention
First-time investors. Vedant Gupte, Co-Founder and CEO of the investment platform Trackk, told Mint he favours large-cap funds through an SIP for first-time investors. His reasoning: a bad first year in small-caps can turn a new investor off markets for a decade.
People with small SIPs. Manish Srivastava, Executive Director at Anand Rathi Wealth, said investors with small SIPs of around ₹1,000 to ₹2,000 per month could consider multi-asset allocation or hybrid funds.
Anyone putting all their SIP money into small-caps. If your whole plan depends on the best-case number, the -0.13% decade is your reminder that the worst case is real.
What to do now
- Check what your SIP actually owns. Look at whether your fund is large-cap, mid-cap, small-cap or a mix. The category drives most of the risk.
- Match the fund to your time horizon. Srivastava told Mint that your goal and horizon should drive the decision, because they decide how much liquidity and which asset mix you need.
- Diversify across sizes. Srivastava suggested a 55:23:22 split across large-, mid- and small-cap funds through active diversified equity schemes.
- Look at valuations, not just recent returns. Mint, citing Trendlyne data, reported the Nifty 100 at a PE ratio of 18.9, below its one-year average of 20.8. The Nifty Smallcap 250 was at 32.5, above its one-year average of 30.7.
- Don't stop an SIP just because of a bad stretch. The data shows longer periods generally improved worst-case outcomes.
Mistakes to avoid
- Treating an SIP as a guarantee. It is a way of investing, not a product with a promised return.
- Chasing last year's winner. Morningstar data quoted by Mint shows large-cap funds at a category average of -9.19% so far this year, while small-cap funds were at 6.87% as of 21 October. Short-term leaders can change fast.
- Mixing up index data with fund returns. These Edelweiss figures are index-based historical calculations, not the returns of any specific scheme you hold.
As Gupte put it: "The smart question isn't which category wins; it's which one lets you stay invested."
FAQs
Can a 10-year SIP really give negative returns? Yes. In Edelweiss's historical index data, the worst 10-year rolling SIP in the Nifty Smallcap 250 TRI ended at -0.13% a year. Large-cap and mid-cap indices stayed positive.
Which category gave the best average 10-year SIP return? Mid-caps. The Nifty Midcap 150 TRI averaged 17.61%, ahead of small-caps at 15.01% and large-caps at 12.95%.
Does this mean I should avoid small-cap funds? Not necessarily. It means small-caps carry wider swings. Many experts suggest holding them as one part of a diversified mix rather than your entire SIP.
Is a five-year SIP safer than a ten-year one? No. In this data, five-year SIPs had deeper worst cases in every category, including -16.81% for small-caps.
This article is for education only and is not investment, tax or legal advice.
Sources
Tagged Topics
Keep reading


Thanks for reading Kali Zubaan
Explore more articles in Personal Finance or return to the main publication feed.