₹1 Lakh in Indian Stocks Is Now ₹93,190. US Stocks: ₹1.13 Lakh
Indian equities are the worst of eight asset classes in 2026 so far, while US stocks and gold gained double digits. Here is the full scorecard and what it means for your portfolio.
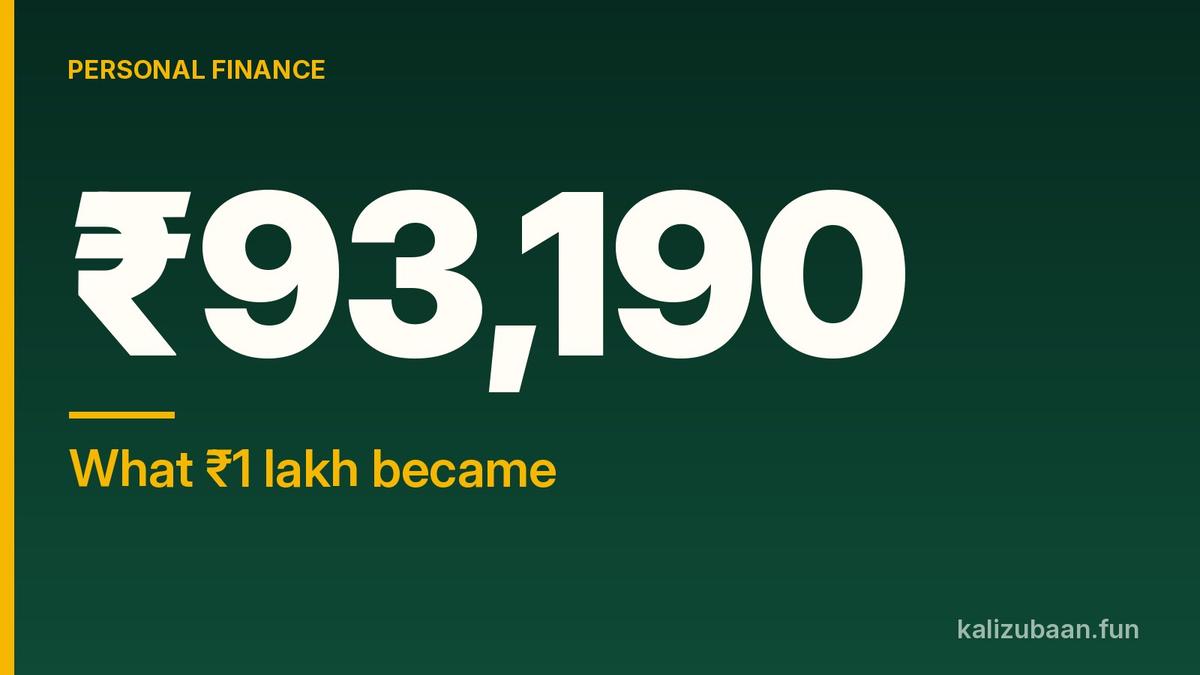
Put ₹1 lakh into Indian stocks on the first day of this year, and by 30 September it would be worth about ₹93,190. Put the same ₹1 lakh into US stocks, and you would have about ₹1.13 lakh.
That gap comes from a research presentation by Edelweiss Mutual Fund, reported by Mint. Out of eight asset classes it tracked, Indian equities came last.
Quick answer
- Indian equities, measured by the NSE 500 TRI, fell 6.81% from January to 30 September 2026.
- US equities (S&P 500 TRI) were the best performer at 12.75%, with domestic gold close behind at 11.56%.
- All three debt categories stayed positive, but with small gains: short-term bonds 3.57%, corporate bonds 2.47% and G-Secs 0.67%.
- Silver and Chinese equities also lost money, which shows that even foreign and precious-metal bets can go wrong.
The full 2026 scorecard
Here is how all eight asset classes did through 30 September, with what ₹1 lakh would have become. These figures are before taxes, fees and transaction costs, and they use Bloomberg data.
| Asset class | 2026 return | Value of ₹1 lakh |
|---|---|---|
| US equities | 12.75% | ₹1,12,750 |
| Gold (domestic price) | 11.56% | ₹1,11,560 |
| Short-term bonds | 3.57% | ₹1,03,570 |
| Corporate bonds | 2.47% | ₹1,02,470 |
| Government securities | 0.67% | ₹1,00,670 |
| China equities | fell 1.38% | ₹98,620 |
| Silver (domestic price) | fell 3.25% | ₹96,750 |
| Indian equities | fell 6.81% | ₹93,190 |
The gap between US and Indian equities was 19.56 percentage points. Gold beat Indian equities by 18.37 percentage points over the same nine months.
What ₹1 lakh became, side by side
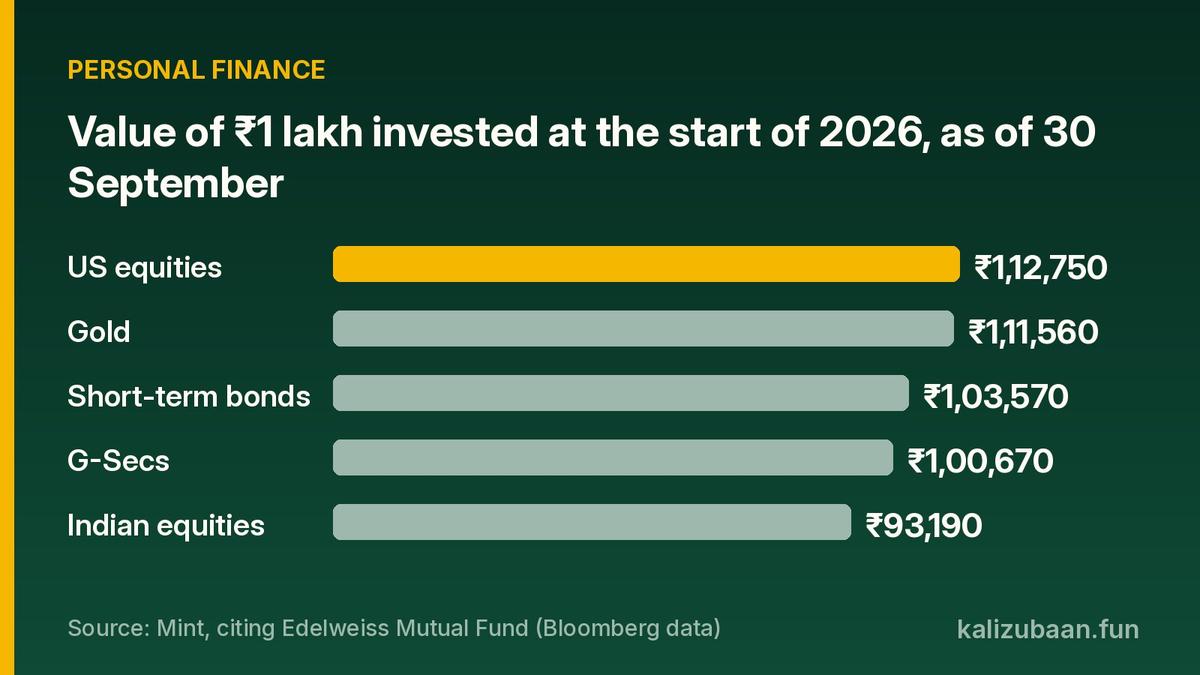
The chart puts the five most common choices for an Indian saver next to each other.
Source: Mint, citing Edelweiss Mutual Fund (Bloomberg data)
The order is clear. US stocks and gold are on top, debt sits in the middle, and Indian equities are at the bottom.
Gold and silver went opposite ways
Many people treat gold and silver as one bet. This year shows why that is risky.
Domestic gold prices rose 11.56%, while silver fell 3.25%. That is a gap of 14.81 percentage points between two metals that often get lumped together.
Gold's run has also pulled in a flood of money. Mint reports that the gold fund of funds industry stood at ₹47,359 crore in August, compared with ₹22,837 crore in September 2025.
That rush is one reason about 20 fund houses have now paused new lump sums and new SIPs in gold FoFs. Existing SIPs continue, and gold ETFs can still be bought on the exchange through a demat account.
Debt did its quiet job
Bonds did not make anyone rich this year, but they did not lose money either. Short-term bonds returned 3.57%, the best of the three debt categories.
₹1 lakh in short-term bonds would have grown to about ₹1.04 lakh. In government securities, it would be about ₹1.01 lakh.
For someone who needed the money soon, that small but steady gain was worth more than a big swing in either direction.
What this means for your money
The real lesson is not "sell Indian stocks and buy US stocks". It is that no single asset wins every year.
Mint's own takeaway was that a mix of Indian equities, international stocks, gold and debt would have given a very different result from holding Indian equities alone.
That is what diversification means. You spread money across assets that do not move in perfect sync, so one bad year in one market does not sink the whole portfolio.
There is a trade-off. A diversified portfolio can never beat its best-performing asset, and it will always beat its worst one. You give up the chance of picking the single winner in return for not being stuck with the single loser.
How to use this scorecard
- Look at your own portfolio and write down what share is in Indian stocks, gold, debt and anything foreign.
- If almost everything is in one asset, ask yourself whether you could live with a year like the one Indian equities just had.
- Set a target mix based on your goals and time horizon, not on whichever asset topped this year's list.
- Rebalance slowly. Moving everything into last year's winner is how people buy high.
- Check costs and taxes before switching. The figures above exclude both.
Mistakes to avoid
Do not chase gold because of the headlines. Experts quoted by Mint warned against buying out of fear of missing out, especially if you already hold enough gold.
Do not read nine months as a forecast. These returns cover January to 30 September only, and any of these rankings can flip next year.
Do not forget that silver and Chinese equities also lost money. Going abroad or into metals is not automatically safer.
FAQs
Which asset class gave the best return in 2026 so far? US equities, represented by the S&P 500 TRI, returned 12.75% through 30 September, the highest of the eight asset classes in the Edelweiss presentation.
How much did Indian equities fall? The NSE 500 TRI fell 6.81% from January to 30 September 2026. ₹1 lakh would have dropped to about ₹93,190.
Did gold beat Indian stocks? Yes. Domestic gold prices rose 11.56%, which put gold 18.37 percentage points ahead of Indian equities.
Did any debt fund category lose money? No. Short-term bonds, corporate bonds and government securities all gave positive returns, though they were small.
Do these numbers include tax? No. The values are illustrative and exclude taxes, fees and transaction costs.
This article is for education only and is not investment, tax or legal advice.
Sources
Tagged Topics
Keep reading


Thanks for reading Kali Zubaan
Explore more articles in Personal Finance or return to the main publication feed.