"Nifty 50 Fell 7.1% in a Year While Gold Gained 18%: Why Your ₹1 Lakh Needs Diversification"
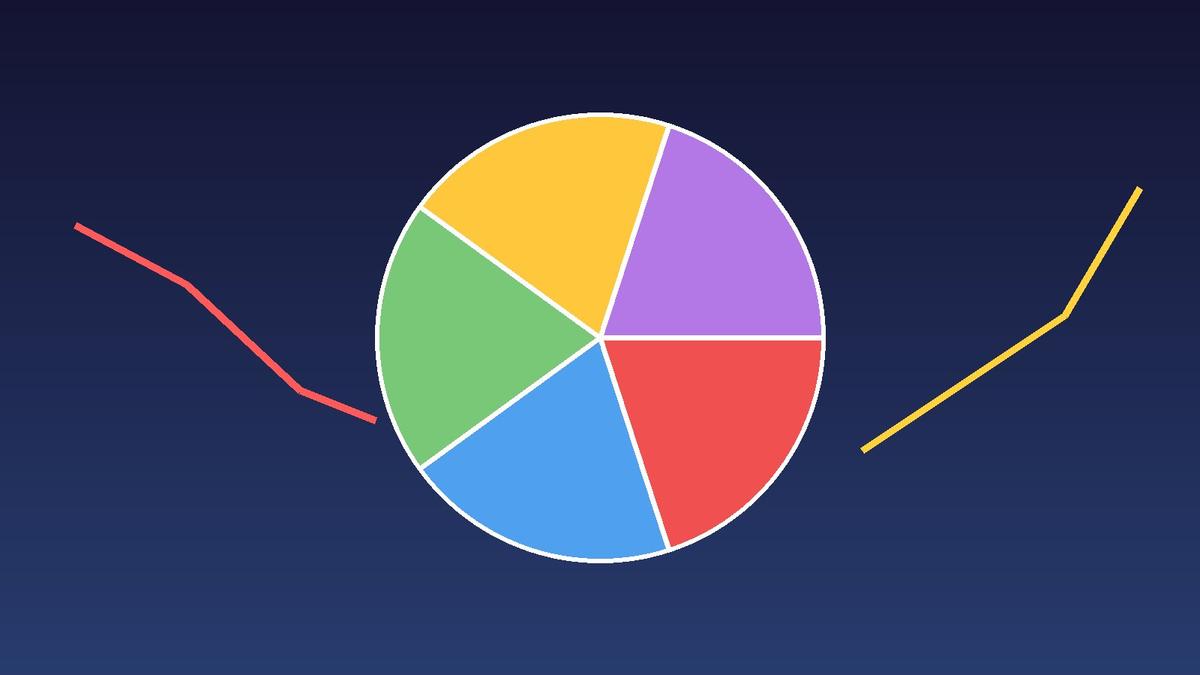
"₹1 lakh in a Nifty 50 index fund fell to about ₹92,900 in a year. Split across five asset classes, it grew to ₹1,09,880. Here's what the October 2026 data shows."
"Indian markets always go up in the long run, just keep investing." If you have heard this in your office WhatsApp group, the last year may have been a painful reality check. The Nifty 50 TRI declined 7.1% over the last one year, according to FundsIndia's Wealth Conversations October 2026 report, covered by Mint.
Meanwhile, other assets did very differently. US equities returned 25%, gold gained 18%, real estate returned 8.5%, and debt delivered 5%. If your entire portfolio was in Indian equity funds, you missed all of that.
Quick answer
- ₹1 lakh in a Nifty 50 index fund would have fallen to about ₹92,900 over the past year.
- The same ₹1 lakh split as ₹20,000 each across five asset classes would be worth ₹1,09,880, a gain of ₹9,880.
- No single asset class led across every time period in the data.
Why this matters now
The FundsIndia data shows CAGR returns as on 30 September 2026. For many newer investors in India who started their SIP journey only recently, this is the first time they're seeing their portfolio in the red for a full year. It's a natural moment to ask: am I too concentrated?
What the numbers actually say
Here is how five asset classes performed across time periods (CAGR):
| Asset Class | 1Y | 3Y | 5Y | 10Y | 15Y | 20Y |
|---|---|---|---|---|---|---|
| India Equity (Nifty 50 TRI) | -7.1% | 6.1% | 6.4% | 11.5% | 12% | 11% |
| Debt | 5% | 6.7% | 6% | 6.7% | 7.5% | 7.5% |
| Real Estate | 8.5% | 7% | 6.9% | 5.5% | 6.1% | 7.5% |
| Gold (in INR) | 18% | 37.2% | 25.4% | 16.4% | 11.4% | 14.3% |
| US Equity (S&P 500 TR in INR) | 25% | 29% | 19.8% | 19.6% | 21% | 15.4% |
Read this table slowly, because it tells a story:
- Over 3 and 5 years, gold was the winner, with 37.2% and 25.4% CAGR. Indian equities and debt, respectively, recorded the lowest returns in those periods.
- Over 10 and 15 years, US equities led, while real estate ranked last.
- Over 20 years, US equities topped the list again at 15.4%, while real estate and debt shared the lowest CAGR of 7.5%.
The point is not "sell Indian equities and buy gold." Indian equities still delivered 11.5% over 10 years and 12% over 15 years. The point is that leadership keeps changing, and nobody can reliably predict which asset will lead next year.
The ₹1 lakh experiment
Mint ran a simple comparison:
Option A: Everything in Nifty 50. ₹1 lakh in an index fund tracking the Nifty 50 would have fallen to around ₹92,900, a loss of ₹7,100 (assuming the index return and ignoring tracking error).
Option B: Spread across five assets. Put ₹20,000 each into Indian equity, debt, real estate, gold and US equity. That portfolio would have been worth ₹1,09,880, a gain of ₹9,880.
Same money, same year, very different outcome. The diversified investor didn't need to predict anything. They just weren't betting everything on one market.
Who is affected
- New SIP investors whose entire portfolio is in Indian large-cap or flexi-cap funds.
- Investors near a goal, like a child's education or a home down payment, who can't afford a bad year at the wrong time.
- People who chase last year's winner. Gold's strong run might tempt you to go all-in. That's just concentration in a different asset.
What to do now
- Check your actual allocation. List every fund you hold and see how much is Indian equity, debt, gold, international and real estate.
- Know the mutual fund routes available. Mint notes investors can consider Indian equity funds across market capitalisations, international funds, debt funds, gold ETFs and REITs (real estate investment trusts), depending on goals and risk appetite.
- Match allocation to your goals and risk appetite, not to recent returns.
- Rebalance periodically, so one asset doesn't silently take over your portfolio after a big run.
- Get help if unsure. A SEBI-registered advisor can help you design an allocation that fits your situation.
Mistakes and red flags
- Thinking diversification means owning five equity funds. If they all hold similar Indian stocks, you are still concentrated.
- Chasing the latest winner. Gold's 37.2% 3Y CAGR doesn't mean it will repeat.
- Panic-selling Indian equities after one bad year. The longer-term data still shows double-digit CAGR for the Nifty 50 TRI over 10, 15 and 20 years.
- Expecting diversification to prevent losses. Mint is clear: it can help spread risk but does not guarantee profits or prevent losses.
FAQs
Did the Nifty 50 really give negative returns in the past year? Yes. According to FundsIndia's October 2026 report, the Nifty 50 TRI returned -7.1% over one year, as on 30 September 2026.
Which asset class performed best over the long term? Over 10, 15 and 20 years, US equities (S&P 500 TR in INR) led the table.
How can an Indian mutual fund investor diversify? Through Indian equity funds across market caps, international funds, debt funds, gold ETFs and REITs, based on objectives and risk appetite.
Does diversification guarantee I won't lose money? No. It can spread risk, but it doesn't guarantee profits or prevent losses.
Is your portfolio entirely in Indian equity right now? Would you add gold or US equities after seeing this data, or stay the course? Tell us in the comments.
This article is for education only and is not investment, tax or legal advice.
Sources
Tagged Topics
Keep reading


Thanks for reading Kali Zubaan
Explore more articles in Personal Finance or return to the main publication feed.