13.19% vs 0.66%: What Missing the Share Market's Best Days Costs
Share market news is full of the 2026 correction. Abakkus data shows staying invested in the Nifty 50 TRI earned 13.19% a year, but missing the 50 best days cut it to 0.66%.
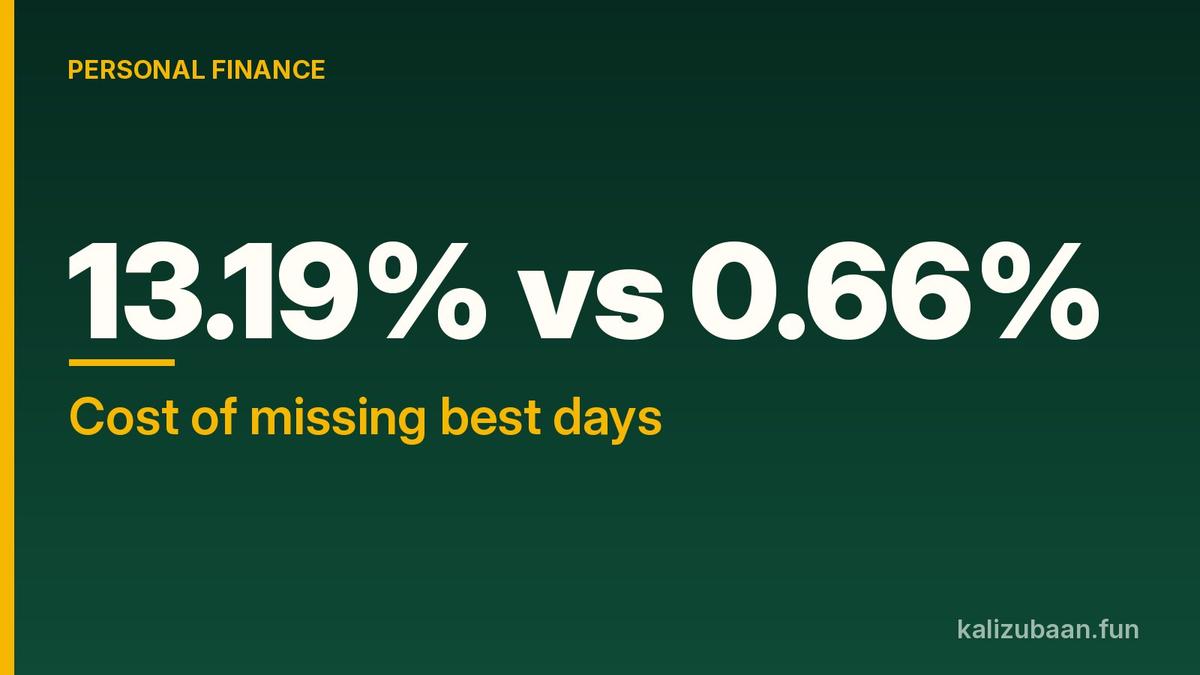
Two investors put money in the Nifty 50 in April 2005. One sat tight through every crash. The other jumped out and back in, and missed just 50 of the best days. By September 2026, the first had earned 13.19% a year. The second had earned 0.66%.
That is the finding of an Abakkus Mutual Fund study reported by Mint. With share market news full of the 2026 correction, it is the most useful number to keep in your head before you hit "redeem".
Quick answer
- The Nifty 50 was at 22,716 on 30 September 2026, still 15.9% short of its 2 January peak of 26,329.
- Staying fully invested in the Nifty 50 TRI from April 2005 to September 2026 delivered a CAGR of 13.19%.
- Missing only the five best days cut that to 10.86%. Missing the 50 best days left just 0.66%.
- Since inception, the index has seen 13 corrections of 10% to 20%, and recovered to its old peak in around 91 days on average.
Where the share market stands today
The Nifty 50 hit a peak of 26,329 on 2 January 2026. It then fell to a March 2026 low of 22,331.
By 30 September 2026 it had climbed back only slightly, to 22,716. Mint says that is up 1.7% from the low, but the index still needs a further 15.9% gain to get back to its peak.
If you started a SIP or bought an equity fund near January, your statement is probably showing red. That is exactly when most people feel tempted to stop.
Share market kya hota hai, in one minute
If you are new, the share market is simply where people buy and sell small pieces of companies, called shares. Prices move every day based on news, profits and mood.
The Nifty 50 is an index that tracks 50 large Indian companies. The Nifty 50 TRI (Total Return Index) also adds back dividends, which makes it a fair yardstick for many equity mutual funds, index funds and ETFs.
A "correction" is a fall of roughly 10% to 20% from a recent peak. A crash is sharper. Wikipedia cites one definition as a "fall in the NIFTY of more than 10% within a span of 20 days".
The cost of trying to time the market
Here is the Abakkus data, for April 2005 to September 2026, based on the Nifty 50 TRI.
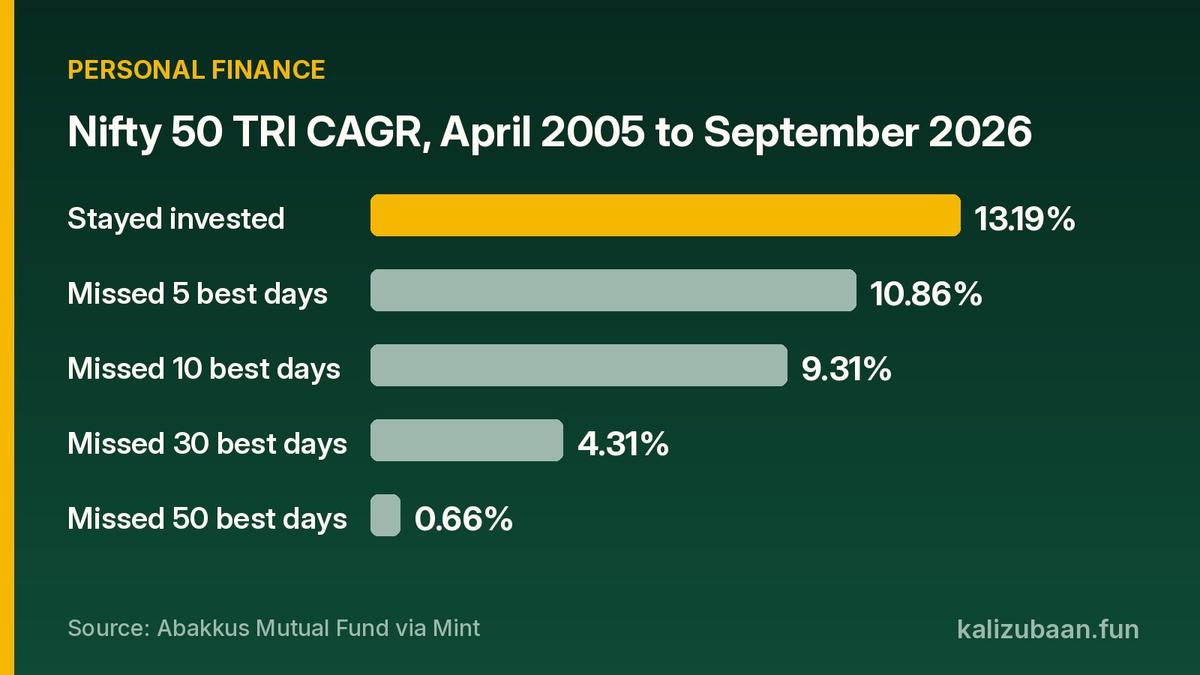
Source: Abakkus Mutual Fund via Mint
Look at how steep the drop is. Five days out of more than two decades took the return from 13.19% to 10.86%. Missing ten days took it to 9.31%.
Missing 30 days brought it down to 4.31%. Missing 50 days, and as Mint puts it, returns "flatlined".
Why does this happen? Mint's reading is that investors who exit during a correction may miss some of the strongest recovery days. If you sell in a panic, you can end up sitting in cash when the bounce arrives.
Corrections are normal, not rare
The study counts 13 corrections of 10% to 20% in the Nifty 50 since its inception. That is approximately one every three years.
From the bottom of these corrections, the index got back to its previous peak in around 91 days on average. Not every recovery is quick, though. Mint notes the longest one followed the March 2025 crash and lasted until January 2026.
India has seen far worse single days. Wikipedia records that the BSE fell 12.77% on 28 April 1992, during the Harshad Mehta scam, and 15.52% on 17 May 2004, its largest one-day fall in percentage terms.
Who should care most
- SIP investors tempted to pause because the last few instalments look negative.
- New investors who started in late 2025 or early 2026 and are seeing their first real fall.
- Anyone switching to cash "until things settle", planning to come back later.
- Traders in futures and options. Wikipedia cites SEBI data that approximately 89% of individual F&O traders lost money in 2021–22. Short-term bets are a very different game from long-term investing.
What to do now
- Check your goal date. Money needed within a year or two should not be in equity funds anyway. Money for five years or more can ride out a correction.
- Keep the SIP running if the goal is long term. A SIP buys more units when prices are low, which is the point of a correction.
- Rebalance, do not run. If equity has grown beyond the share you planned, trimming to your target mix is a plan. Selling everything out of fear is not.
- Avoid checking prices every hour. Share market today open, stock market live tickers and daily headlines feed the urge to act.
- Review the fund, not the market. If your scheme keeps lagging its own benchmark, that is a separate reason to switch.
Mistakes and red flags
- Selling after the fall, buying after the rally. That is the pattern that misses the best days.
- Treating index data as a fund promise. Mint notes these figures are for the benchmark and do not represent any specific scheme.
- Using emergency money in equity. If you might need it next month, a correction can force you to sell at the bottom.
FAQs
Should I stop my SIP during a market correction? For long-term goals, the Abakkus data suggests staying invested has worked better than exiting. Missing even five strong days cut the CAGR from 13.19% to 10.86%.
How long does the Nifty 50 take to recover from a correction? Around 91 days on average from the bottom, across 13 corrections of 10% to 20%. Some recoveries, like the one after March 2025, took much longer.
How far is the Nifty 50 from its peak? On 30 September 2026 it was at 22,716 and needed a 15.9% gain to return to the 26,329 peak.
Do these returns apply to my mutual fund? No. They are for the Nifty 50 TRI. Your fund's returns depend on its own portfolio and costs.
This article is for education only and is not investment, tax or legal advice.
Sources
Tagged Topics
Keep reading



Thanks for reading Kali Zubaan
Explore more articles in Personal Finance or return to the main publication feed.